


Want a FREE Warehouse Labeling Checklist?
Enter your information and get a free checklist of the top questions to answer and tips to plan a successful asset tagging project for any warehouse management system implementation.

Warehouse KPIs are the quantifiable metrics that measure how efficiently a facility receives, stores, picks, packs and ships inventory, and the right set tells warehouse and facility managers where labor, accuracy and cost are slipping before customers feel it. Order picking alone can account for as much as 55% of total warehouse operating expense (de Koster, Le-Duc and Roodbergen, 2007), and labor runs 50% to 70% of the warehouse budget, so the metrics you choose decide where you find savings.
This guide breaks down the 10 most important warehouse KPIs across every stage of warehouse operations, from receiving through returns, with the formula for each and the benchmark world-class operations hit, so you can build a warehouse performance management plan that holds up.
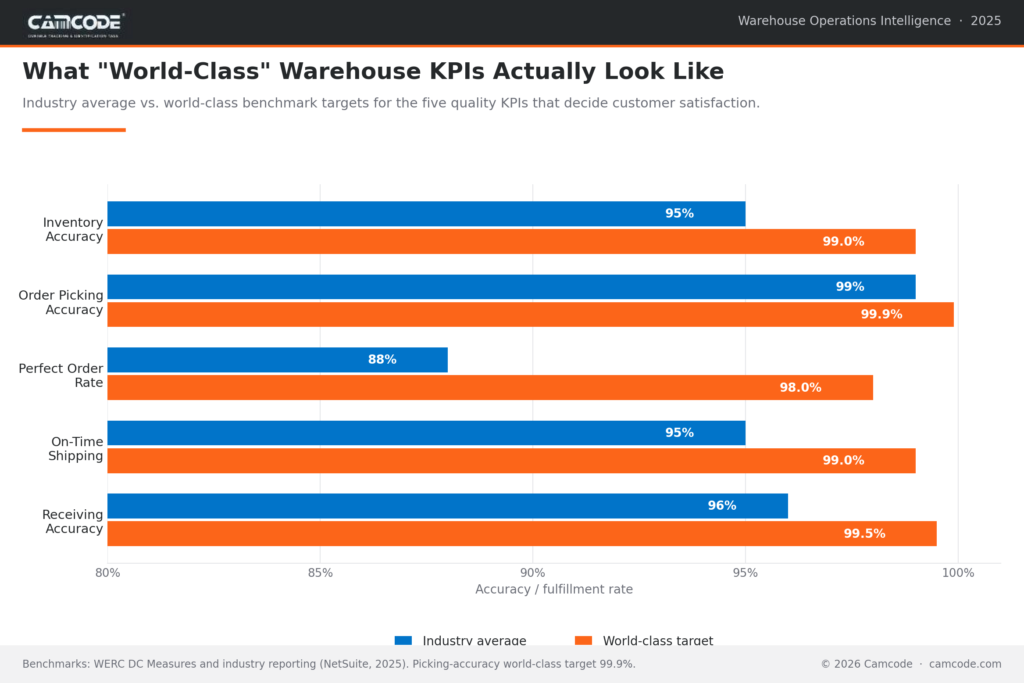
Industry-average vs world-class warehouse KPI benchmarks. Sources: WERC DC Measures and NetSuite (2025).
Key performance indicators (KPIs), also referred to as metrics, are measurements of specific functions that, when monitored over time, can provide insight into how performance is declining or improving in the warehouse. As a unified performance benchmark, a set of warehouse KPIs can be measured together to provide management and individual team members with reasonable goals and performance targets.
There are hundreds of possible metrics that can be used, so it’s important to select values that are meaningful for your unique operation. Many warehouse KPIs are also more insightful when reviewed in groups to truly describe the current state for each working area. We’ve structured this post to follow the major steps on the warehouse floor from receiving through order fulfillment.
Here are the 15 warehouse KPIs that matter most, ordered by where they happen on the floor, from receiving through returns. Use it as a quick reference, and use the anchors to jump to any metric below for its formula and benchmark.
Knowing the benchmarks is one thing, but seeing where your own warehouse lands is another. Use the warehouse KPIs calculator below to enter your numbers for any metric on this list and instantly see how you compare to industry and world-class targets.
Pick a KPI, enter two numbers, and see your result against industry benchmarks with a plain-English verdict.
Pick a KPI and enter your two numbers to see your result and how it compares to industry benchmarks.
Any part of a warehouse operation can become a bottleneck, and it’s especially important to have a streamlined receiving workflow. The arrival time of incoming shipments could change at any moment, and any delays in receiving will often impact all subsequent steps within the warehouse facility.
Warehouse KPIs like this metric analyze the throughput of received material as related to the amount of work planned for each employee.
It is calculated as Volume of inventory received / Total number of staff hours, which gives you units received per labor hour.
Track it by shift to spot where receiving slows.
Warehouse labor productivity measures how much work each paid hour produces. The core metric is units processed per labor hour
It is calculated as Total units received, picked, packed or shipped / Total labor hours.
The data behind these KPIs is becoming the differentiator:
“As the promise of agentic AI for warehouse process automation, real-time inventory visibility, predictive maintenance and demand forecasting grows, high-quality data will be essential to utilizing this technology to drive efficiency and agility.”
– Quoted: John Paxton, CEO, MHI (2025 Annual Industry Report).
That is the case for measuring accuracy and timeliness rigorously now, before layering automation on top.
Because labor accounts for 50% to 70% of the warehouse operating budget, this is the fastest single KPI for finding cost. Track it separately by function (receiving, picking, packing) and by shift, so a low overall number points you to the specific area dragging the average down rather than to the whole floor.
During the put-away step, warehouse workers move goods from the receiving area to their proper inventory storage location in the warehouse. If the routes and steps associated with put-away are not well defined, it can lead to a backup of material on the receiving dock or inventory stock-outs on the warehouse floor.
Also, called put-away productivity, this warehouse KPI is a measure of the amount of stock that is relocated as compared to the amount of effort assigned to the task.
It is calculated as Volume of stock put away / Number of worker hours.
The speed at which put-away activities take place is also an essential metric. Establishing a baseline gives warehouse staff a benchmark from which to drive improvements.
It’s calculated as Total time taken to complete each put-away assignment.
Warehouse KPIs like dock-to-stock time measures how long received inventory takes to become pickable, from the moment a truck is unloaded to the moment the item is put away and live in the system.
It is calculated as Total elapsed time from receipt to Put-away completion.
A slow dock-to-stock time hides inventory from order picking and backs material up on the receiving dock, so it connects receiving performance directly to fulfillment. Many high-performing operations target standard receipts moving to stock within a few hours; set your own baseline first, then drive it down.
Optimizing storage space in a warehouse is a major priority. These warehouse KPIs help understand the dynamics at play and can help warehouse managers identify additional ways to increase storage space and decrease picking cycle times by improving item placement.
An accurate inventory count is paramount to running an effective warehouse operation. This metric verifies that the actual inventory present on the warehouse floor matches what is recorded in the system.
It’s calculated as Inventory management system count / Physical inventory count.
World-class operations hold inventory accuracy at 97% or higher (NetSuite, 2025); below 95% and stockouts become routine.
Warehouse KPIs like inventory turnover help warehouse managers understand how quickly items are moving through the warehouse. In general terms, a more rapid turnover signals a more efficient operation.
Inventory turnover is calculated as Number of sales made / Average inventory level.
There is no universal target: healthy turnover is industry-specific, so benchmark against your own sector and prior periods rather than a single number.
Storage (or capacity) utilization measures how much of your available storage cube is actually in use.
It’s calculated as (Occupied storage capacity / Total storage capacity) x 100.
Throughput measures the volume of inventory moving through the facility over a set period. Read together they diagnose slow order cycle times: utilization running very high points to congestion, while low utilization with slow picks points to poor slotting.
The goal is not maximum utilization, it is the level that keeps pick paths short while leaving room to receive.
Inventory carrying cost is the total cost of holding stock over a period, expressed as a percentage of average inventory value. It rolls up capital cost, storage and handling, insurance, taxes and the cost of obsolescence and shrinkage.
This warehouse KPI is calculated as (Total holding costs / Average inventory value) x 100. Inventory that sits is cash that cannot work elsewhere, which is why carrying cost and inventory turnover are best read as a pair.

The fulfillment process connects incoming orders (demand) with the supply that is stored within the warehouse. Several different warehouse KPIs and metrics can be tracked to ensure that orders are being fulfilled efficiently and without significant errors.
Each warehouse will have unique dynamics based on the type of business and industries served. The cost per order helps quantify the overall cost to fulfill orders from a given warehouse.
It’s calculated as Total fulfillment cost / Total number of orders.
For reference, pick-and-pack alone averaged $3.18 per B2C order and $4.79 per B2B order in 2024.
The warehouse KPI known as order cycle time is a measurement of the time needed to complete a customer order, from placement through delivery.
It’s calculated as Total time from order entry to package delivery.
This metric is represented as a percentage and is a good choice for understanding the overall effectiveness of order fulfillment activities.
It’s calculated as (Total orders delivered correctly / Total number of orders) x 100.
Average operations land at 85 to 90%; best-in-class reach 97 to 98% and top performers exceed 99.5% (NetSuite, 2025).
The picking and packing steps of warehouse fulfillment involve preparing orders to be shipped to customers. Often a labor-intensive part of the workflow, it’s important to monitor these warehouse KPIs/steps to ensure there are no significant bottlenecks.
This metric gives a useful overall picture of picking effectiveness. It can be used as a baseline and tracked to determine if other workflow changes are improving or decreasing these values.
Picking accuracy is calculated as: (Total orders picked error-free / Total order number) x 100.
The benchmark is 99% or better, with 99.9% as the world-class target (WERC DC Measures); each point below that drives returns and re-ships.
A warehouse must also be able to handle returns and, in some cases, return items back onto the warehouse floor. Measuring returns is important for understanding their impact and determining the best way to deploy resources for managing these orders.
Items can be returned for several different reasons, and it’s always important to troubleshoot each return individually. Measuring the overall return rate helps a company understand if returns are increasing or decreasing over time.
It’s calculated as Total number of returned items / Total items shipped.
Pair the rate with return-reason codes so you can separate the controllable share (mispicks, damage) from the uncontrollable share (buyer’s remorse).
Safety metrics belong in any serious set of warehouse KPIs because every incident stops throughput and adds cost, so tracking them protects both your people and your numbers.
Recordable indecent rate and error rate (also known as damage rate) are two measures that carry most of the signal.
The recordable incident rate is the number of OSHA-recordable injuries per 100 full-time employees per year. It is calculated as (Recordable incidents x 200,000) / Total hours worked.
The error or damage rate captures product damaged in handling.
It is calculated as (Units damaged / Units handled) x 100.
Falling error rates usually track with better training and slotting, so safety and quality improve together.
As discussed above, it’s essential to select a full suite of KPIs that, together, create a complete picture of warehouse operations. No individual metric is useful without the proper context, and it may take time to identify the best measurements and establish baseline values.
Implementing warehouse bar code labels, such as warehouse rack labels, long-range retro-reflective bar code labels and signs, returnable container labels and pallet bar code labels, can not only help streamline measurement, but they can also make your processes more efficient to improve KPIs across your warehouse management operation.
Industry analysts frame the shift the same way:
“Leading supply chains are embracing AI not simply to automate tasks, but to fundamentally redesign how work gets done between people and machines.”
– Quoted: Laura Rainier, Senior Director Analyst, Gartner Supply Chain (2026).
For warehouse teams, that means KPIs increasingly measure how well people and automation work together, not just raw output.
By using this post as a guide and conducting additional research, you can create a warehouse reporting plan with the most important warehouse KPIs that aligns your team and leads to improved performance.
The most important warehouse KPIs map to each stage of the floor:
Most operations track 8 to 12 at once so no stage is blind.
If you can only track five, start with the following:
Together they cover stock integrity, customer-facing quality, labor efficiency and cost.
Picking accuracy, inventory accuracy, dock-to-stock time and labor productivity respond most to warehouse automation such as barcode scanning, fixed and mobile readers and warehouse management systems.
Each removes a manual step where errors and delay enter.
World-class operations hold inventory accuracy at 97% or higher (NetSuite, 2025); below 95%, stockouts and overstock both become routine. Cycle counting is the most reliable way to close the gap.
Our sales engineers are experts in automatic asset tracking, tagging and identification,a nd can answer all your questions. Get in touch now.
Lets Talk ›Enter your information and get a free checklist of the top questions to answer and tips to plan a successful asset tagging project for any warehouse management system implementation.