































How to Improve Warehouse Productivity and Efficiency: 8 Methods, KPIs and Benchmarks



Walking. That is where warehouse productivity goes. Travel accounts for roughly 50% of an order picker’s working time in the research summarized by de Koster, Le-Duc and Roodbergen in the European Journal of Operational Research (2007), and order picking as a whole eats about 55% of a typical warehouse’s operating budget. Those hours are not cheap. Warehousing and storage employers paid an average of $26.74 an hour in July 2026 across 1.84 million workers, according to the Bureau of Labor Statistics.
So the honest answer to “how do I improve warehouse productivity” is: find out where the labor hours actually go, then go after the biggest bucket. In nearly every building we walk, that bucket is travel and search time in picking and putaway. This guide covers the KPIs to baseline, eight methods that reliably raise output per labor hour, a worked example with real numbers and the advice that has held up from the warehouse leaders Camcode has interviewed over the years.
 CAMCODE
Enter your picking numbers to see the labor hours and dollars a per-pick time saving frees up each year.
Lines picked in a shift divided by picker labor hours.
8 seconds is a conservative figure for moving from paper pick lists to scan-confirmed picking at labeled locations.
BLS average hourly earnings for warehousing and storage, July 2026: $26.74.
Annual direct labor freed
Every second removed from search and confirmation time compounds across every line, every shift.
Warehouse productivity is output divided by the resources used to produce it, while warehouse efficiency is the share of available capacity that went to productive work. Productivity is measured as order lines picked per labor hour, units received per labor hour or orders shipped per labor hour. Efficiency looks at the same shift from the other side: how much of the labor hours, dock doors and storage cube you paid for was actually put to use. A warehouse can be perfectly efficient, with everyone busy all shift, and still be unproductive because everyone is busy walking. Improving one usually improves the other, which is why this guide treats them together.
The math is not complicated. Take the units of output for a period and divide by the direct labor hours spent producing them. A pick team that clears 6,400 order lines in an 8-hour shift with 10 pickers is running 80 lines per labor hour. Track that by shift, by zone and by process (receiving, putaway, picking, packing, shipping), because a single blended number hides which bucket moved when you changed something.
One caution from the benchmark data. The WERC 2026 DC Measures Report (May 2026) tracks 36 operational metrics, and the five most widely used are on-time shipments, dock-to-stock cycle time, average capacity used, peak capacity used and backorders as a percentage of lines. Only one of those is a pure speed metric. Programs that chase throughput alone tend to buy speed with accuracy, and the accuracy bill shows up later as returns, recounts and chargebacks.
Track the KPIs that expose lost labor: lines per labor hour, order picking accuracy, dock-to-stock time, inventory accuracy by location and on-time shipments. Between them they answer three questions. Is work getting done? Is it getting done right? Are errors upstream creating rework downstream?
| KPI | What it measures | Best-in-class benchmark (WERC 2026) |
| Order picking accuracy | Lines picked correctly as a share of lines picked | 99.7% or higher |
| On-time shipments | Orders shipped by the promised date | 99.5% or higher |
| Dock-to-stock cycle time | Hours from receipt to available-to-pick | Under 3.1 hours |
| Lines per labor hour | Pick lines completed per direct labor hour | Set your own baseline; varies by order profile |
| Inventory accuracy by location | Records that match a physical count at the bin | Aim for 99% or better by cycle count |
In the 2026 WERC data, best-in-class order picking accuracy is 99.7% or better, on-time shipments 99.5% or better and dock-to-stock under 3.1 hours. If your facility sits at 98% picking accuracy, that sounds close. On 6,400 lines a shift it is 128 wrong picks a day, and every one of them costs a pack-out check, a return or a customer credit. Camcode’s guide to the most important warehouse KPIs has the formulas and a reporting cadence for each.
Eight methods do most of the work: measure the baseline, slot by velocity, shorten pick paths, label and scan every location, fix inventory accuracy, standardize with 5S, automate the process with the clearest payback and hold on to the people who run the floor. They appear here in the order most facilities should tackle them, because each one makes the next one cheaper.
Record lines per labor hour, picking accuracy and dock-to-stock time for at least two weeks before you change a thing. William Bauer, Managing Director of Royce Leather, said it plainly in Camcode’s expert panel: “You can’t improve something you haven’t measured.” A two-week baseline by shift and zone also shows the spread between your best crew and your worst, which is often the biggest productivity gap in the building and the cheapest one to close.
A labor management system does this automatically, but only 50% of facilities run one, according to Modern Materials Handling’s 2026 Automation Study. A WMS report fed by scan timestamps is enough to start.
Put the fastest-moving SKUs closest to the pack station and at the easiest picking height, roughly waist to shoulder. Since travel is about half of pick time, moving the top 20% of SKUs into that golden zone shortens the average pick path more than any piece of equipment will. Ron Atapattu, Founder of Overseas Cargo Inc., told Camcode his most reliable gain came from “constantly reviewing the velocity of your SKUs to optimize slotting.” Quarterly is the minimum. Seasonal businesses should re-slot monthly.
Only 36% of facilities use slotting software (MMH 2026 Automation Study). A velocity report out of the WMS works fine if someone acts on it.
Batch picking combines orders onto one cart, zone picking assigns pickers to fixed areas and wave picking releases orders in timed groups sequenced by location. All three cut the number of times a picker walks the same aisle for separate orders. Here is a cheap test: batch 8 to 12 single-line e-commerce orders onto one cart, route them in location sequence and compare lines per labor hour against discrete picking for one week. For most operations this is the single largest jump in picking productivity they will ever see from a process change.
Camcode’s guide to warehouse optimization goes deeper on the four picking techniques that cut travel.
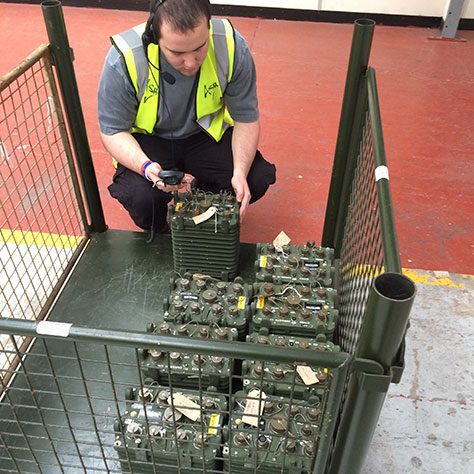
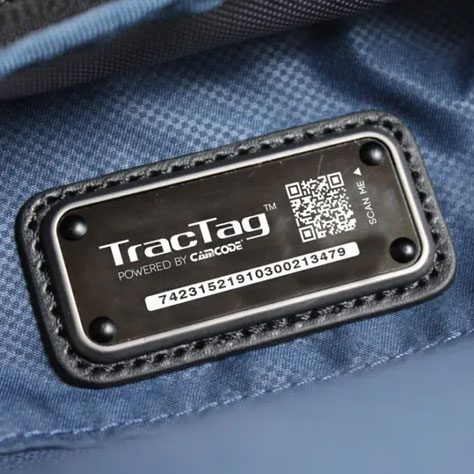
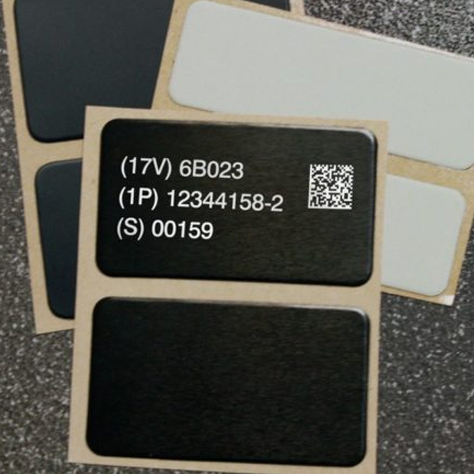
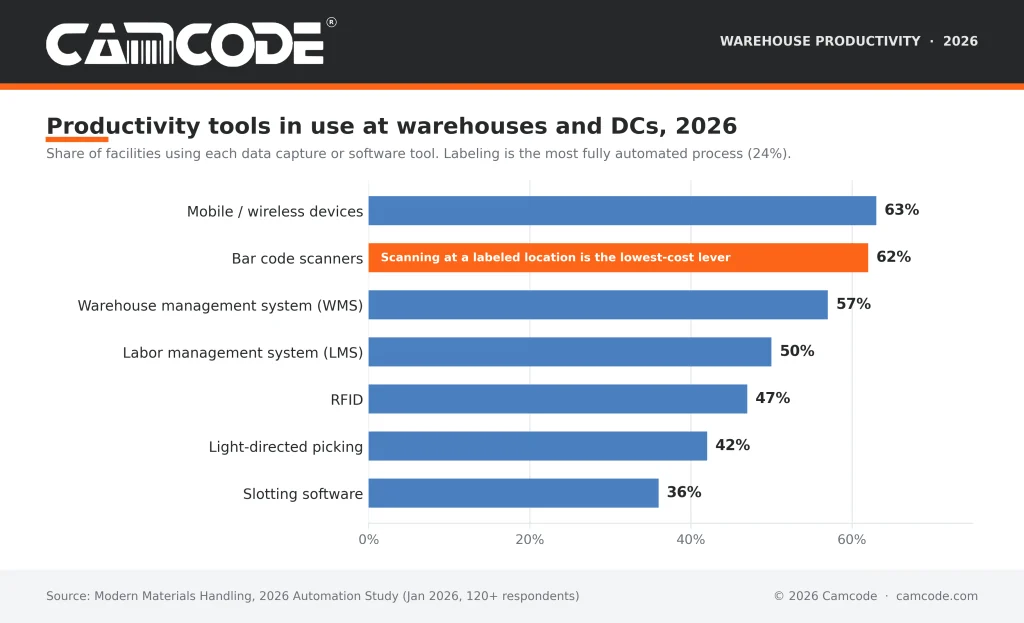
Put a scannable label on every location and scan every move. That one change strips search time and keying errors out of picking, putaway, replenishment and cycle counting at once. A picker who can read a rack label from the aisle and confirm the pick with one scan through the warehouse barcode system does not stop to hunt, does not misread a handwritten tag and does not key a location number. Bar code scanners are already in use at 62% of facilities, and labeling is the most fully automated warehouse process at 24% (MMH 2026 Automation Study). Even so, plenty of buildings still run with unlabeled floor spots, faded rack labels and nothing on the upper beams that a forklift operator can scan.
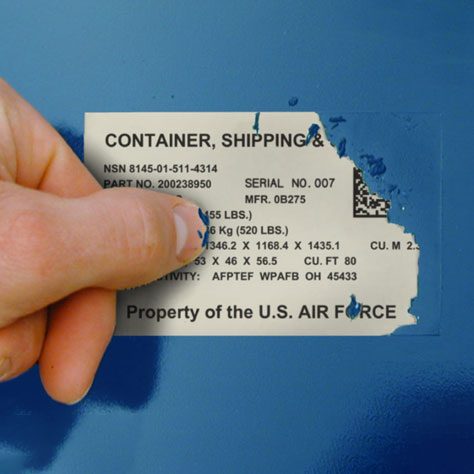
A complete warehouse labeling system has four parts: rack labels on every beam level, warehouse floor labels or floor signs for bulk and staging areas, long-range retro-reflective labels that forklift operators can scan from the seat and location signs at aisle ends so a new hire can find a zone without asking. Durability is not a detail here. A label that peels or fades in year two puts the search time right back where it was. Camcode’s guide on how to label warehouse racking covers numbering schemes and placement.
The 2024 Zebra Warehouse Vision Study, which surveyed more than 1,700 associates and decision-makers, found 82% of decision-makers agree technology increases frontline productivity and 71% named error mitigation as their top reason to automate. Scanning at the location is the lowest-cost version of both.
Cycle count by location every day and fix the root cause of each discrepancy, not just the record. Bad records send pickers to empty bins, trigger emergency replenishment and force recounts at pack-out. The scale of the problem is well documented. DeHoratius and Raman (Management Science, 2008) found 65% of nearly 370,000 inventory records inaccurate across 37 stores of one retailer, and Chuang and Oliva (Journal of Operations Management, 2015) put the profit hit from record inaccuracy at about 10%.
That 2015 study found something else worth repeating: full-time labor reduces record inaccuracy and part-time labor does not. That is a productivity argument for keeping trained counters on the job instead of rotating temps through it. Scan-confirmed counts (scan the location label, scan the item, key the quantity) are faster than clipboard counts and leave no transcription errors behind.
5S (sort, set in order, shine, standardize, sustain) recovers the minutes lost every shift to hunting for carts, pallet jacks, tape guns and empty totes. Of the seven lean wastes, motion and waiting are the two that show up most in a warehouse. Mark a home position for every piece of shared equipment, post the standard work at each pack station and audit it weekly. Joseph Flahiff, a strategic leadership consultant on Camcode’s panel, recommended asking “the people who work in the warehouse, on a regular basis” for improvement ideas, because they see the waste long before a manager does.
Camcode’s guide on how to organize a warehouse walks through a 5S rollout for storage and staging areas.
Start with conveyance, labeling or a goods-to-person pick zone for your fastest SKUs, not a full building retrofit. The MMH 2026 Automation Study puts average automation spending at $1.6 million per facility in 2026, with 12% of picking and only 3% of retrieval fully automated. Automation raises productivity only when the process underneath it is already stable. An automated system fed mislabeled inventory or inaccurate records just produces errors faster.
Label and scan first, fix accuracy second, then automate. Camcode’s overview of warehouse automation compares the options and their typical payback periods.
Every new hire runs below standard for weeks and every open position pulls a supervisor onto the floor, so retention is a productivity metric whether or not it is on the dashboard. In the transportation, warehousing and utilities sector the hires rate was 3.9% and total separations 3.8% in July 2026 (BLS JOLTS). Employers are replacing nearly as many people as they add every month. The 2024 Zebra study found 85% of associates agree technology boosts their productivity and 89% feel more valued when given modern tools, so equipment and labeling investments double as retention investments.
Cross-train every picker on receiving and every receiver on packing so a volume swing does not idle one team while another falls behind. Post lines per labor hour by team rather than by individual, and talk about it in the shift huddle.
Small per-pick savings compound into a surprising number of labor hours. Take a facility with 10 pickers, 8 hours a shift, 250 shifts a year, running 80 lines per labor hour. That is 45 seconds per line and 1.6 million lines a year.
Now suppose new rack labels and scan-confirmed picks trim 8 seconds of search and confirmation time from each line, a conservative figure for a building moving from paper pick lists to scan-directed picking. The pick cycle drops to 37 seconds and the same team completes about 97 lines per labor hour, a 21.6% improvement. At the BLS average of $26.74 an hour, the 1.6 million lines that took 20,000 labor hours now take about 16,450. That frees roughly 3,550 hours, or about $95,000 a year in direct labor, before counting a single accuracy benefit. A rack labeling project for a 10-picker facility costs a fraction of that, which is exactly why labeling sits ahead of automation in the sequence above.
Run the same arithmetic with your own line count, cycle time and wage rate. If you do not know your cycle time, that is the first measurement to take.
Improving warehouse efficiency reduces costs because the same four cost lines absorb nearly all of the waste: labor, space, inventory carrying cost and error handling. Order picking alone accounts for about 55% of warehouse operating expense in the de Koster 2007 review, so any method that removes picker travel is a cost program as much as a productivity program. The table below maps each of the eight methods to the cost line it attacks and the KPI that proves it worked.
| Method | Cost line it reduces | KPI that proves it |
| Measure the baseline | Overtime and temp labor (spend goes where the variance is) | Lines per labor hour by shift |
| Slot by velocity | Direct picking labor | Lines per labor hour, travel distance per order |
| Batch, zone and wave picking | Direct picking labor | Lines per labor hour |
| Label and scan every location | Labor, error handling, training time | Order picking accuracy, dock-to-stock time |
| Bin-level inventory accuracy | Carrying cost, expedites, lost sales | Inventory accuracy by location, backorders as % of lines |
| 5S and lean | Motion and waiting time, safety incidents | Lines per labor hour, incident rate |
| Targeted automation | Direct labor at peak, space (go up, not out) | Throughput at peak, capacity used |
| Training and retention | Recruiting, onboarding, supervisor time | Separations rate, weeks to standard |
Two cost lines deserve a closer look. Space first: Joe Schodowski’s “go up, not out” advice matters because adding beam levels is far cheaper than adding square footage, and long-range labels on the upper levels keep those locations scannable from the forklift seat. Error handling second: at 98% picking accuracy a 6,400-line shift produces 128 mis-picks a day, and every one carries a pack-out check, a return shipment or a customer credit. Getting to the WERC best-in-class mark of 99.7% cuts that to about 19. Camcode’s guide to warehouse operations covers the receiving, putaway and shipping processes where the remaining cost hides.
The leaders Camcode interviewed for a previous version of this article landed on a short list: measure first, slot by velocity, use vertical space, ask the floor and question vendor data. Joe Schodowski, President of Shelving Inc., summed up the space side as “Go up not out. Use the maximum existing vertical space,” which shortens horizontal travel as a side effect. Jennifer Martin, a business coach who works with operations teams, made the slotting point in one line: make sure “top selling products are the easiest to get to.”
Lior Krolewicz, Founder of Yael Consulting, pointed upstream: “Reexamine vendor lead time,” because padded lead times in the system create excess inventory that then has to be stored, counted and moved. The thread running through all of it is that productivity problems are usually information problems first. The floor cannot move faster than the data it is working from.
Improving warehouse productivity is a sequence, not a shopping list. Measure lines per labor hour and picking accuracy, slot by velocity, batch the picks, label and scan every location, get bin-level records to 99% and only then spend on automation. Each step takes a bite out of the travel and search time that eats half of a picker’s shift, and each step makes the next one cheaper. Facilities that follow the order usually find that the labeling and accuracy work pays for the automation that comes later.
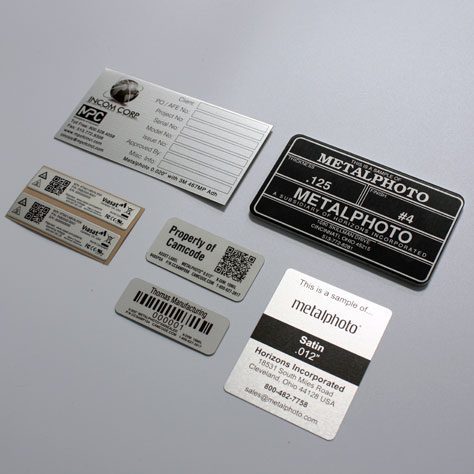
Camcode manufactures the durable rack, floor, long-range and pallet labels that make scan-directed work possible. Request a free warehouse label sample kit and test them in your own aisles.
It depends on your order profile, but best-in-class facilities in the WERC 2026 DC Measures Report pick at 99.7% accuracy or better, ship 99.5% of orders on time and move received goods to stock in under 3.1 hours. Lines per labor hour varies widely: 60 to 100 is common for manual case picking, while pick-to-light or goods-to-person systems run 150 to 300 or more. Baseline your own facility by shift and zone rather than chasing a universal number.
Divide output (order lines, units, orders or pallets) by the direct labor hours consumed to produce it, usually per process and per shift. Pair that throughput number with an accuracy number such as order picking accuracy so faster work is not simply producing more errors. Most WMS and labor management systems calculate both from scan timestamps.
Cut travel and search time, which together make up more than half of a picker’s shift. Re-slot the fastest 20% of SKUs into the locations nearest the pack station, batch small orders onto one cart routed in location sequence and make sure every location carries a scannable barcode label so pickers confirm with one scan instead of reading and keying.
Labels remove the time a worker spends finding, reading and confirming a location. A scannable rack, bin or floor label lets a picker or forklift operator verify the location in about a second, eliminates keying errors and gives the WMS an accurate timestamp for every move. Long-range reflective labels extend the same benefit to forklift operators, who can scan upper beam levels without leaving the seat.
A warehouse management system directs each task (putaway, pick, replenishment, count) to a specific labeled location and confirms it with a scan, which removes the search, decision and keying time from every move and records a timestamp for measuring lines per labor hour. It reduces errors by validating the location and item barcode before the task closes, and it reduces cost by routing pickers in location sequence and flagging inventory discrepancies for cycle counting. The MMH 2026 Automation Study found 57% of facilities run a WMS and 50% a labor management system, and both depend on a complete location labeling system to work.
The tools with the fastest payback are barcode location labels (rack, bin, floor and long-range), handheld or wearable scanners, a WMS or labor management system that records scan timestamps and a slotting report driven by SKU velocity. Pick-to-light, voice picking and goods-to-person systems come next for higher-volume operations. In the MMH 2026 Automation Study, mobile and wireless devices (63%) and bar code scanners (62%) were the most widely adopted data capture tools, ahead of RFID (47%) and light-directed picking (42%).
Roughly 10% of total profit, according to Chuang and Oliva’s 2015 study in the Journal of Operations Management, and DeHoratius and Raman found 65% of records inaccurate in a 2008 retail study of nearly 370,000 records. In the warehouse the cost shows up as pickers sent to empty bins, emergency replenishment, recounts and shipping errors. Daily scan-confirmed cycle counts by location are the standard fix.
Our sales engineers are experts in automatic asset tracking, tagging and identification, and can answer all your questions. Get in touch now.
Lets Talk ›Enter your information and get a free checklist of the top questions to answer and tips to plan a successful asset tagging project for any warehouse management system implementation.